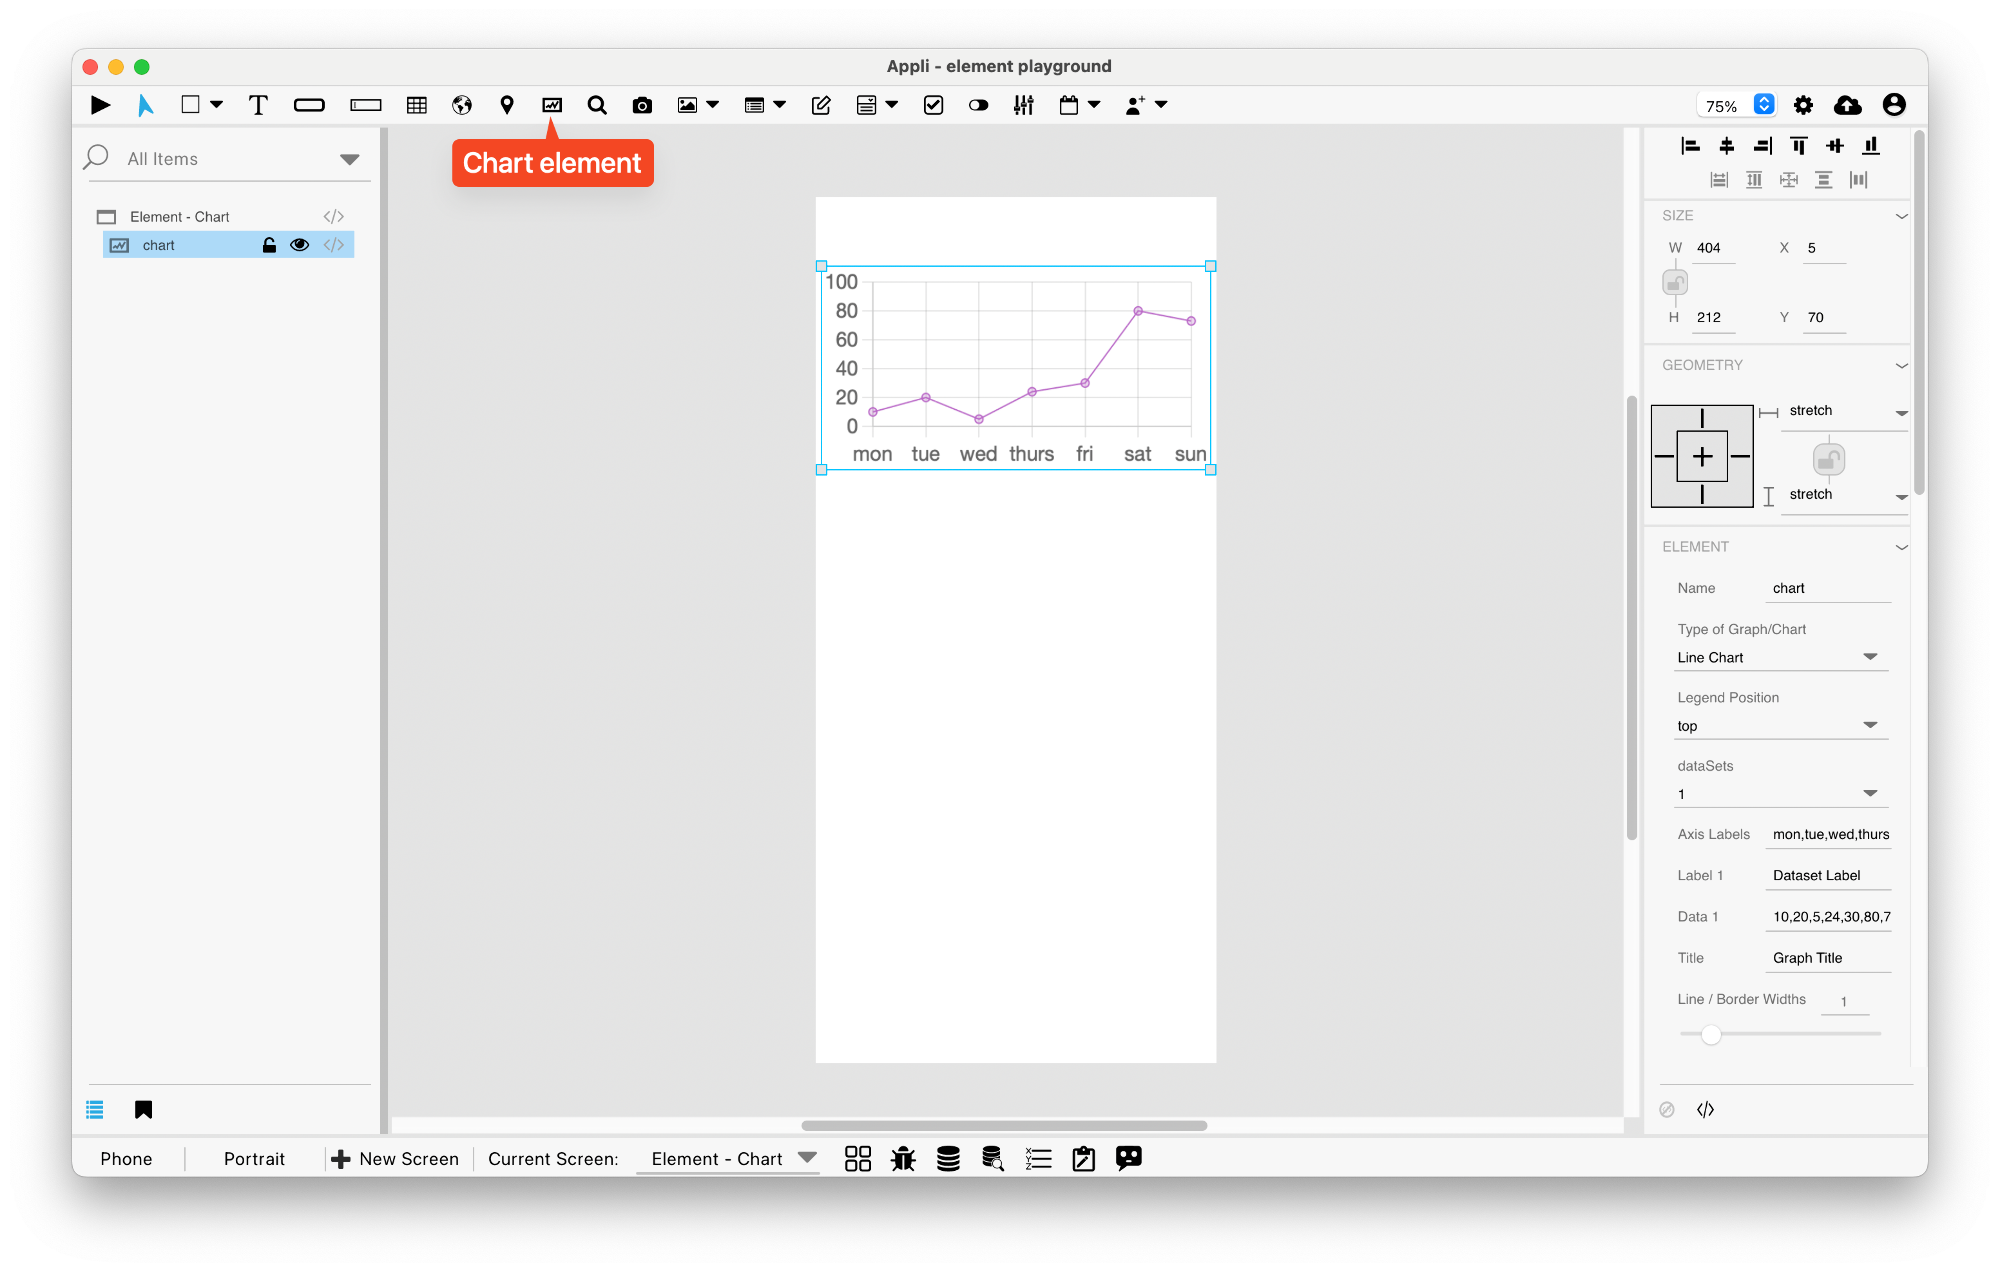
Element: Chart
This element represents a chart on the screen.
Events
Charts have a mouseUp event that can be configured using low-code. This event is triggered when the user clicks or touches the graphic.
Properties
Size Section
This section is used to configure the chart size and position.
| Property | Description |
|---|---|
| width | The value in pixels representing the distance between the left side of the element and its right side. |
| left | The value in pixels representing how distant element is from the left side of the window. |
| height | The value in pixels representing the distance between the bottom side of the element and its top side. |
| top | The value in pixels representing how far the element is from the top of the window. |
| lockAspectRatio | Locks the aspect ratio of the element. |
Geometry Section
Use the properties in this section to configure the responsive design behaviors for the element.
| Property | Description |
|---|---|
| responsive | sets if the element size should be responsive. |
| responsiveX | how the element resizes responding to screen changes in the X axis. |
| responsiveY | how the element resizes responding to screen changes in the Y axis. |
| lockResponsiveAspectRatio | Locks the aspect ratio of the element. |
| allowUnderNotch | Stretch to fill notch |
Element Section
This section is contains properties that are specific to elements of type chart.
| Property | Description |
|---|---|
| name | The name of the element. Displayed in the project browser. |
| graphType | Type of Graph/Chart |
| legendPosition | Legend Position |
| dataSets | dataSets |
| indexAxis | Axis for the index. |
| axisLabels | Axis Labels |
| dataSetLabel1 | Label 1 |
| dataSetData1 | Data 1 |
| dataSetLabel2 | Label 2 |
| dataSetData2 | Data 2 |
| graphTitle | Title for the graph / chart. |
| displayTitle | Display Title |
| borderWidths | Line / Border Widths |
| suggestedMinY | Suggested Y Min |
| suggestedMaxY | Suggested Y Max |
| autoCalculateMinMaxY | Auto Calculate Min Max |
| beginAtZero | Begin at Zero |
| useFontRatioApple | Configures Font ratio on Apple devices. |
| useFontRatioAndroid | Configures Font ratio on Android |
| xAxisLabelsFontSize | X Axis Font Size |
| mobileXAxisFontSizeRatio | Mobile X FontSize Ratio |
| yAxisLabelsFontSize | Y Axis Font Size |
| mobileYAxisFontSizeRatio | Mobile Y FontSize Ratio |
| tooltipTitleFontSize | Tooltip Title Font Size |
| tooltipTitleFontSizeRatio | Tooltip Title Ratio |
| tooltipBodyFontSize | Tooltip Body Font Size |
| tooltipBodyFontSizeRatio | Tooltip Body Ratio |
| colorTransparency | Transparency percentage |
| lineBarPieColor1 | Color 1 |
| lineBarPieColor2 | Color 2 |
| lineBarPieColor3 | Color 3 |
| lineBarPieColor4 | Color 4 |
| lineBarPieColor5 | Color 5 |
| lineBarPieColor6 | Color 6 |
| lineBarPieColor7 | Color 7 |
| lineBarPieColor8 | Color 8 |
This chapter was last updated on Fri 8 May 2026 15:20:15 BST