Debug Mode
Debugging is an important skill for a developer. Learning to use a debugger is a crucial step in becoming better at debugging which may sound a bit nonsensical but most developers today don’t actually know how to use a debugger. Most developer rely on displaying messages or setting variables to figure out what is wrong with their apps.
There are other ways to troubleshoot an app and using Debug Mode is the most powerful of them. Debug Mode is how Appli calls it’s debugger, which means Appli can be running in one of three modes:
- Play Mode: which is when you’re trying your application out while developing it inside Appli builder.
- Pointer Mode: which is when you’re using the builder to develop your app.
- Debug Mode: which is in between both modes, your application is running but you have access to the low-code editor and other tools.
Debug Mode allows you to stop the execution of a Low-Code script at a line of your choice and then resume or step through other preselected actions. While stepping through your code, you can also use the Variable Viewer to inspect the values of variables as they change according to your script execution.
Entering Debug Mode
Before we switch Debug Mode on, we need some breakpoints. Breakpoints are tied to a Low-Code script line (or action). You can add as many breakpoints as you want and wherever the execution of a script hits that line, it will stop and display the Low-Code editor for you. Be aware that the debugger will only stop at breakpoints, once you tell it to keep going it will either hit another breakpoint of your choosing or just keep executing as normal.
To add a breakpoint, click the line number next to the action you want.
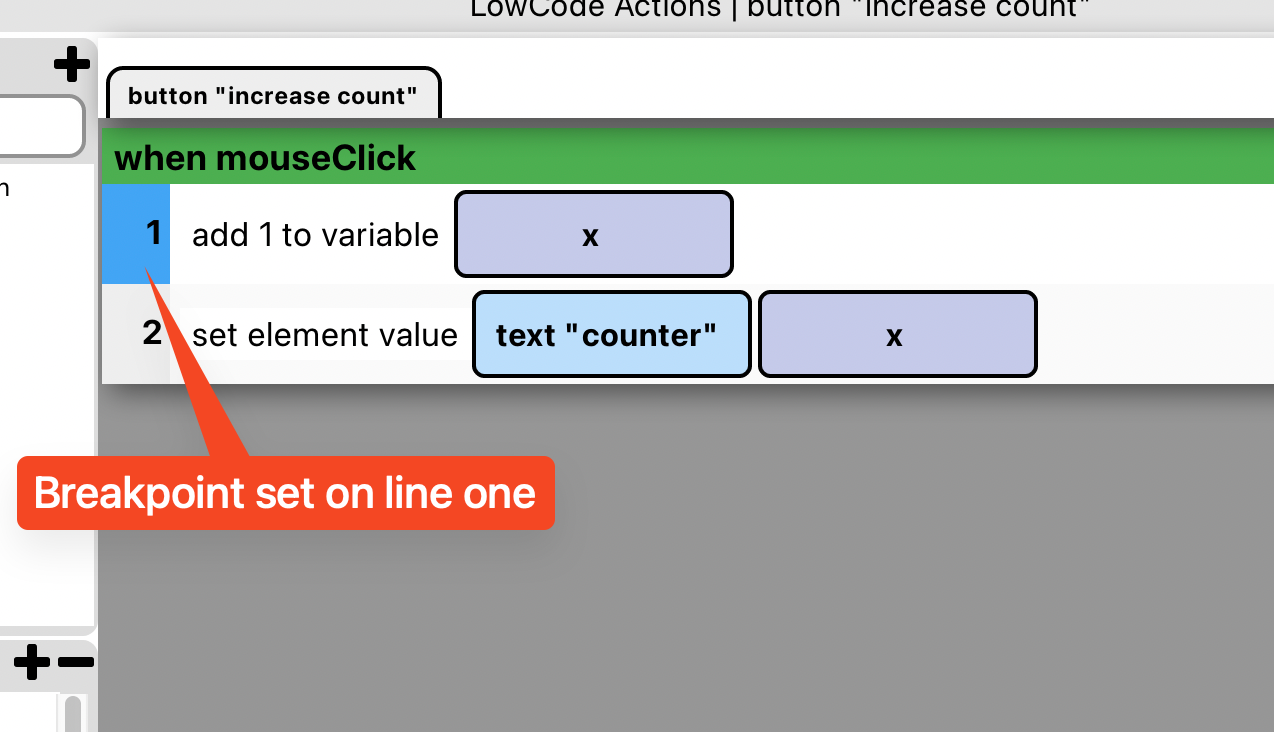
On this other example, we have two breakpoints set:
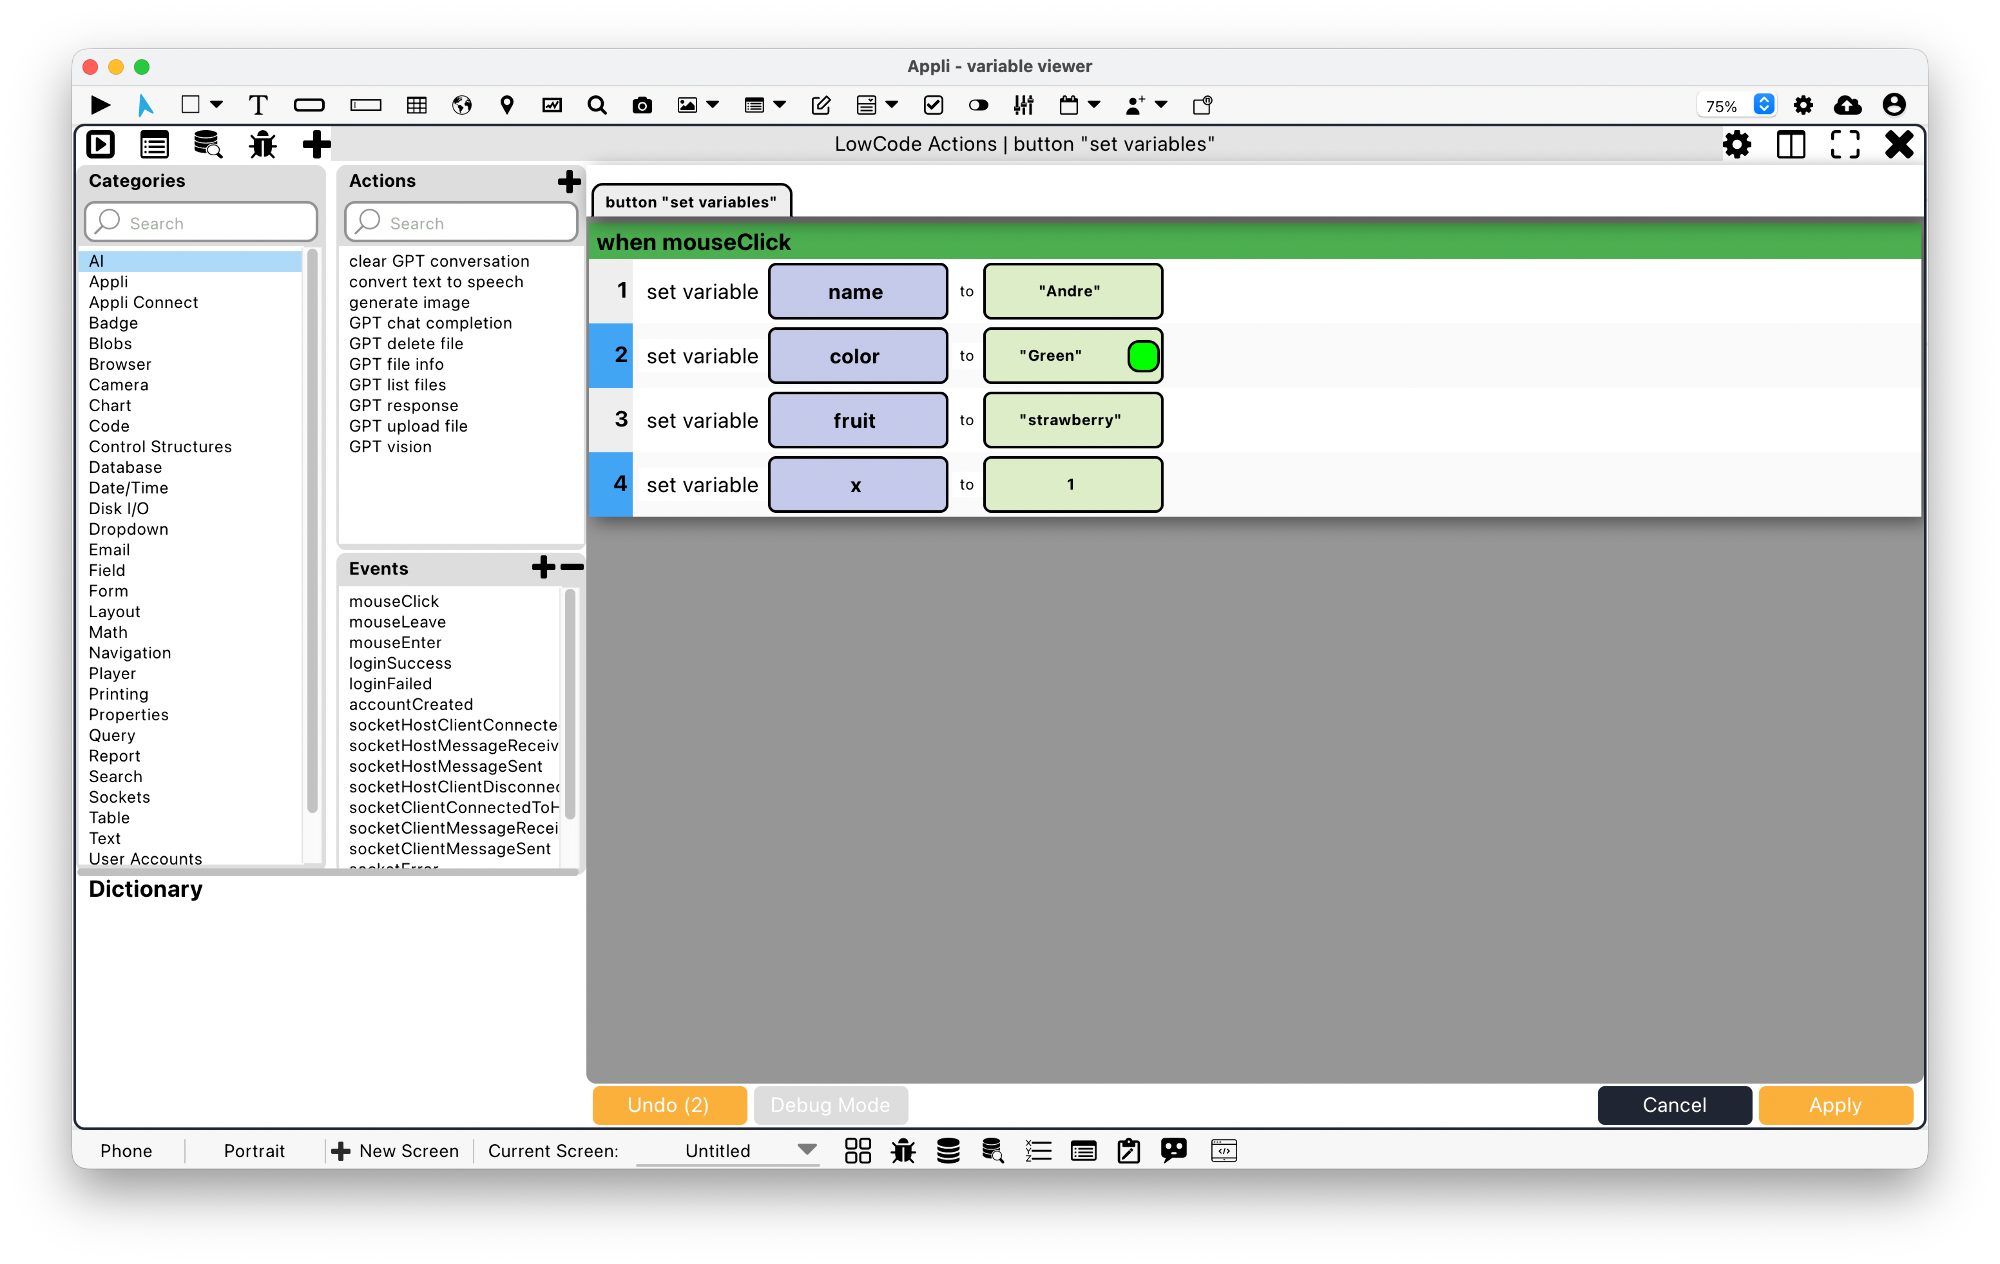
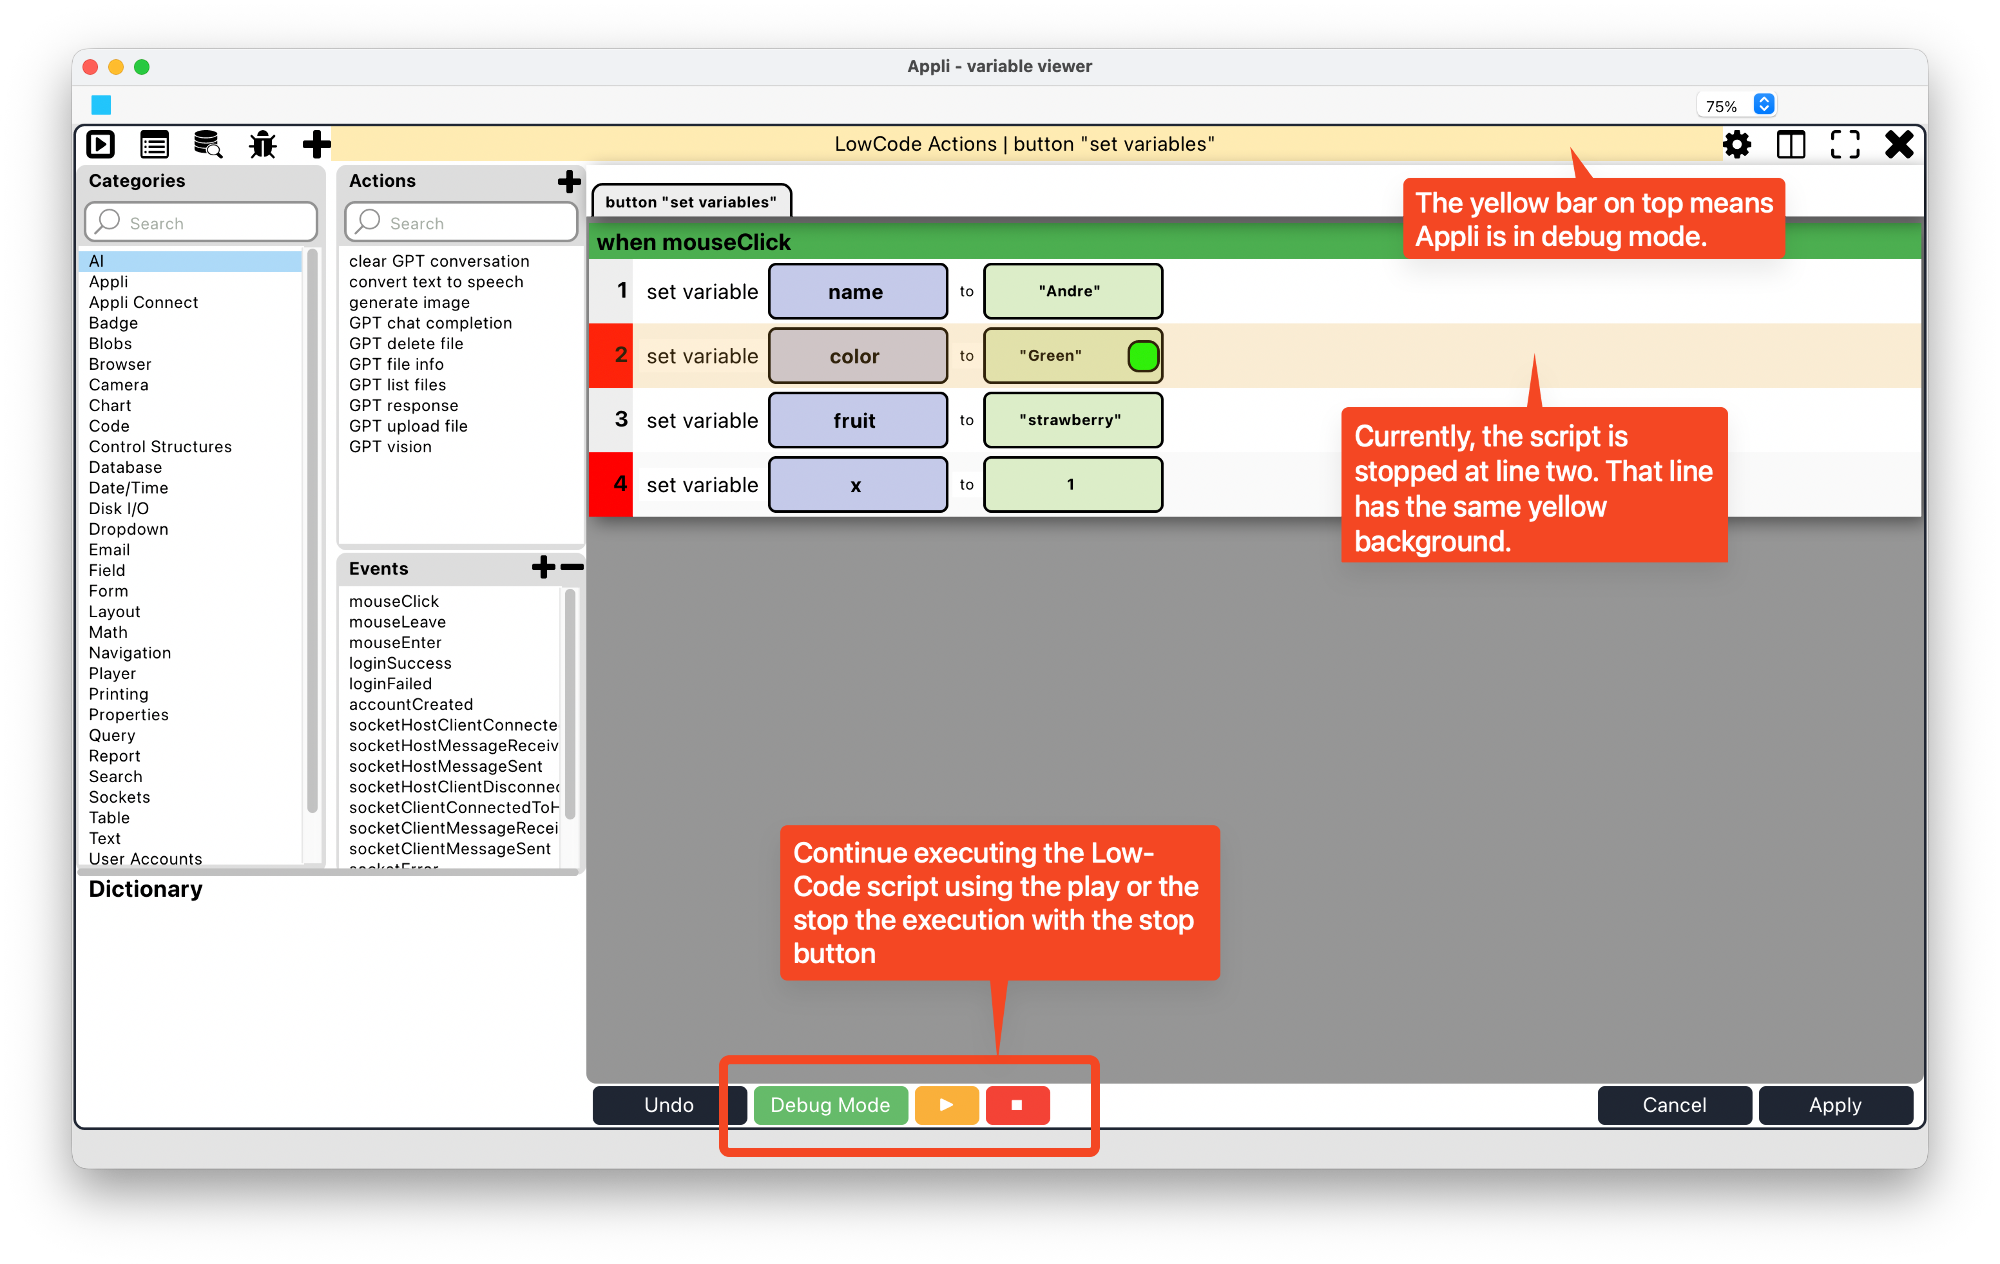
After setting the breakpoints, you need to click Debug Mode to activate it. It will turn green when active.

Important: You need to click Apply after setting breakpoints and enabling Debug Mode just like you do with any other script changes.
Notice that once the Debug Mode is active, two new buttons appear: Play and Stop. These will allow you to control your debugging experience once you’re running in Debug Mode.
After you set your breakpoints and activate Debug Mode for the scripts you want, you can click Apply and then switch into Play Mode to test your application. Once you trigger any Low-Code script with a breakpoint, the Low-Code editor will open showing the Debug Mode controls.
Debug Mode becomes a lot more useful if you use the button on the Low-Code editor tool bar to open the Variable Viewer or the Data Viewer (if you’re trying to debug database changes).
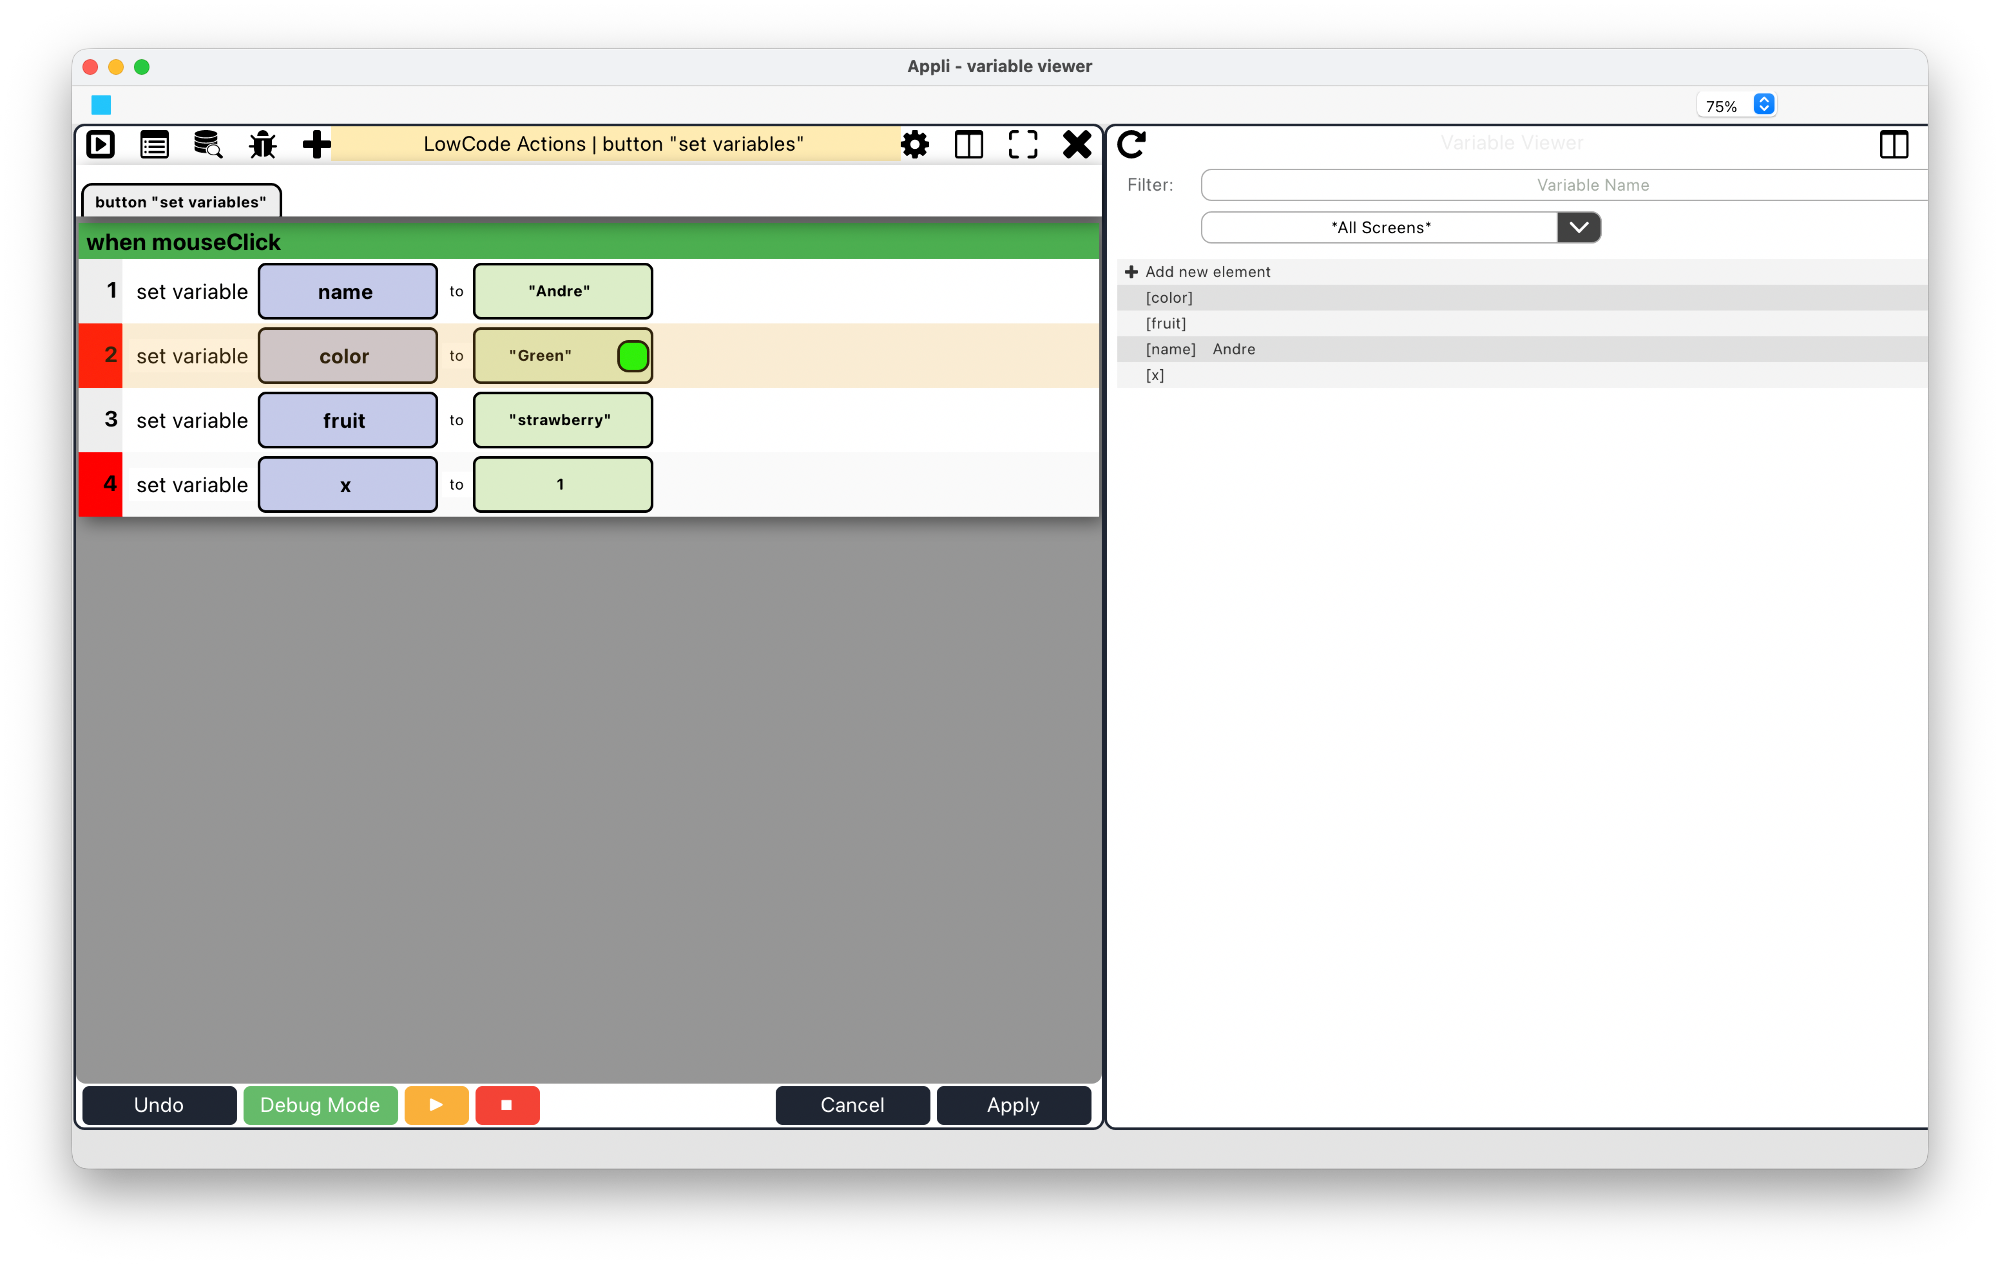
You can use the layout buttons on the Low-Code toolbar to stack both the Low-Code editor and the Variable Viewer side by side.
Notice how in the screenshot above, the variable name is
set but the variable color has no value. That is because
the script is stopped before executing that line. If you press the
Play button next to the Debug Mode button at the
bottom, Appli will execute that action and all other actions until it
reaches another breakpoint. In the case of the script in the screenshot,
it will stop at line four as can be seen below:

By that point in the script all variables are set except the
x variable.
Pressing the Stop button will stop script execution. Going back to the Low-Code editor and clicking Debug Mode will disable it.
When to use Debug Mode
Sometimes, your app is not behaving as intended and a cursory look at the scripts can’t tell you why. Debug Mode will be your ally there and allow you to go line by line double checking variables, flow, and database entries as your code executes.
Instead of waiting until you have an app with a bug to learn to use Debug Mode, we advise you to give it a spin now with your current project. Just set some breakpoints, enable Debug Mode, and get familiar with how it works. Time practicing now will save you time when you really need it.
Next Steps
Next, we’ll explore what are events and how you can use them to make your application respond to user action.
This chapter was last updated on Mon 5 Jan 2026 19:58:41 GMT